Dashboard Tiles displays the different statistical data on the My Dashboard page, such as course count, lesson count, total students, etc.
The display of these tiles is fully controlled by the Admin of the site. He can enable/disable the tiles according to the convenience.
Navigate to WB Plugins >> LD dashBoard >> Dashboard Tiles, and find the below options:
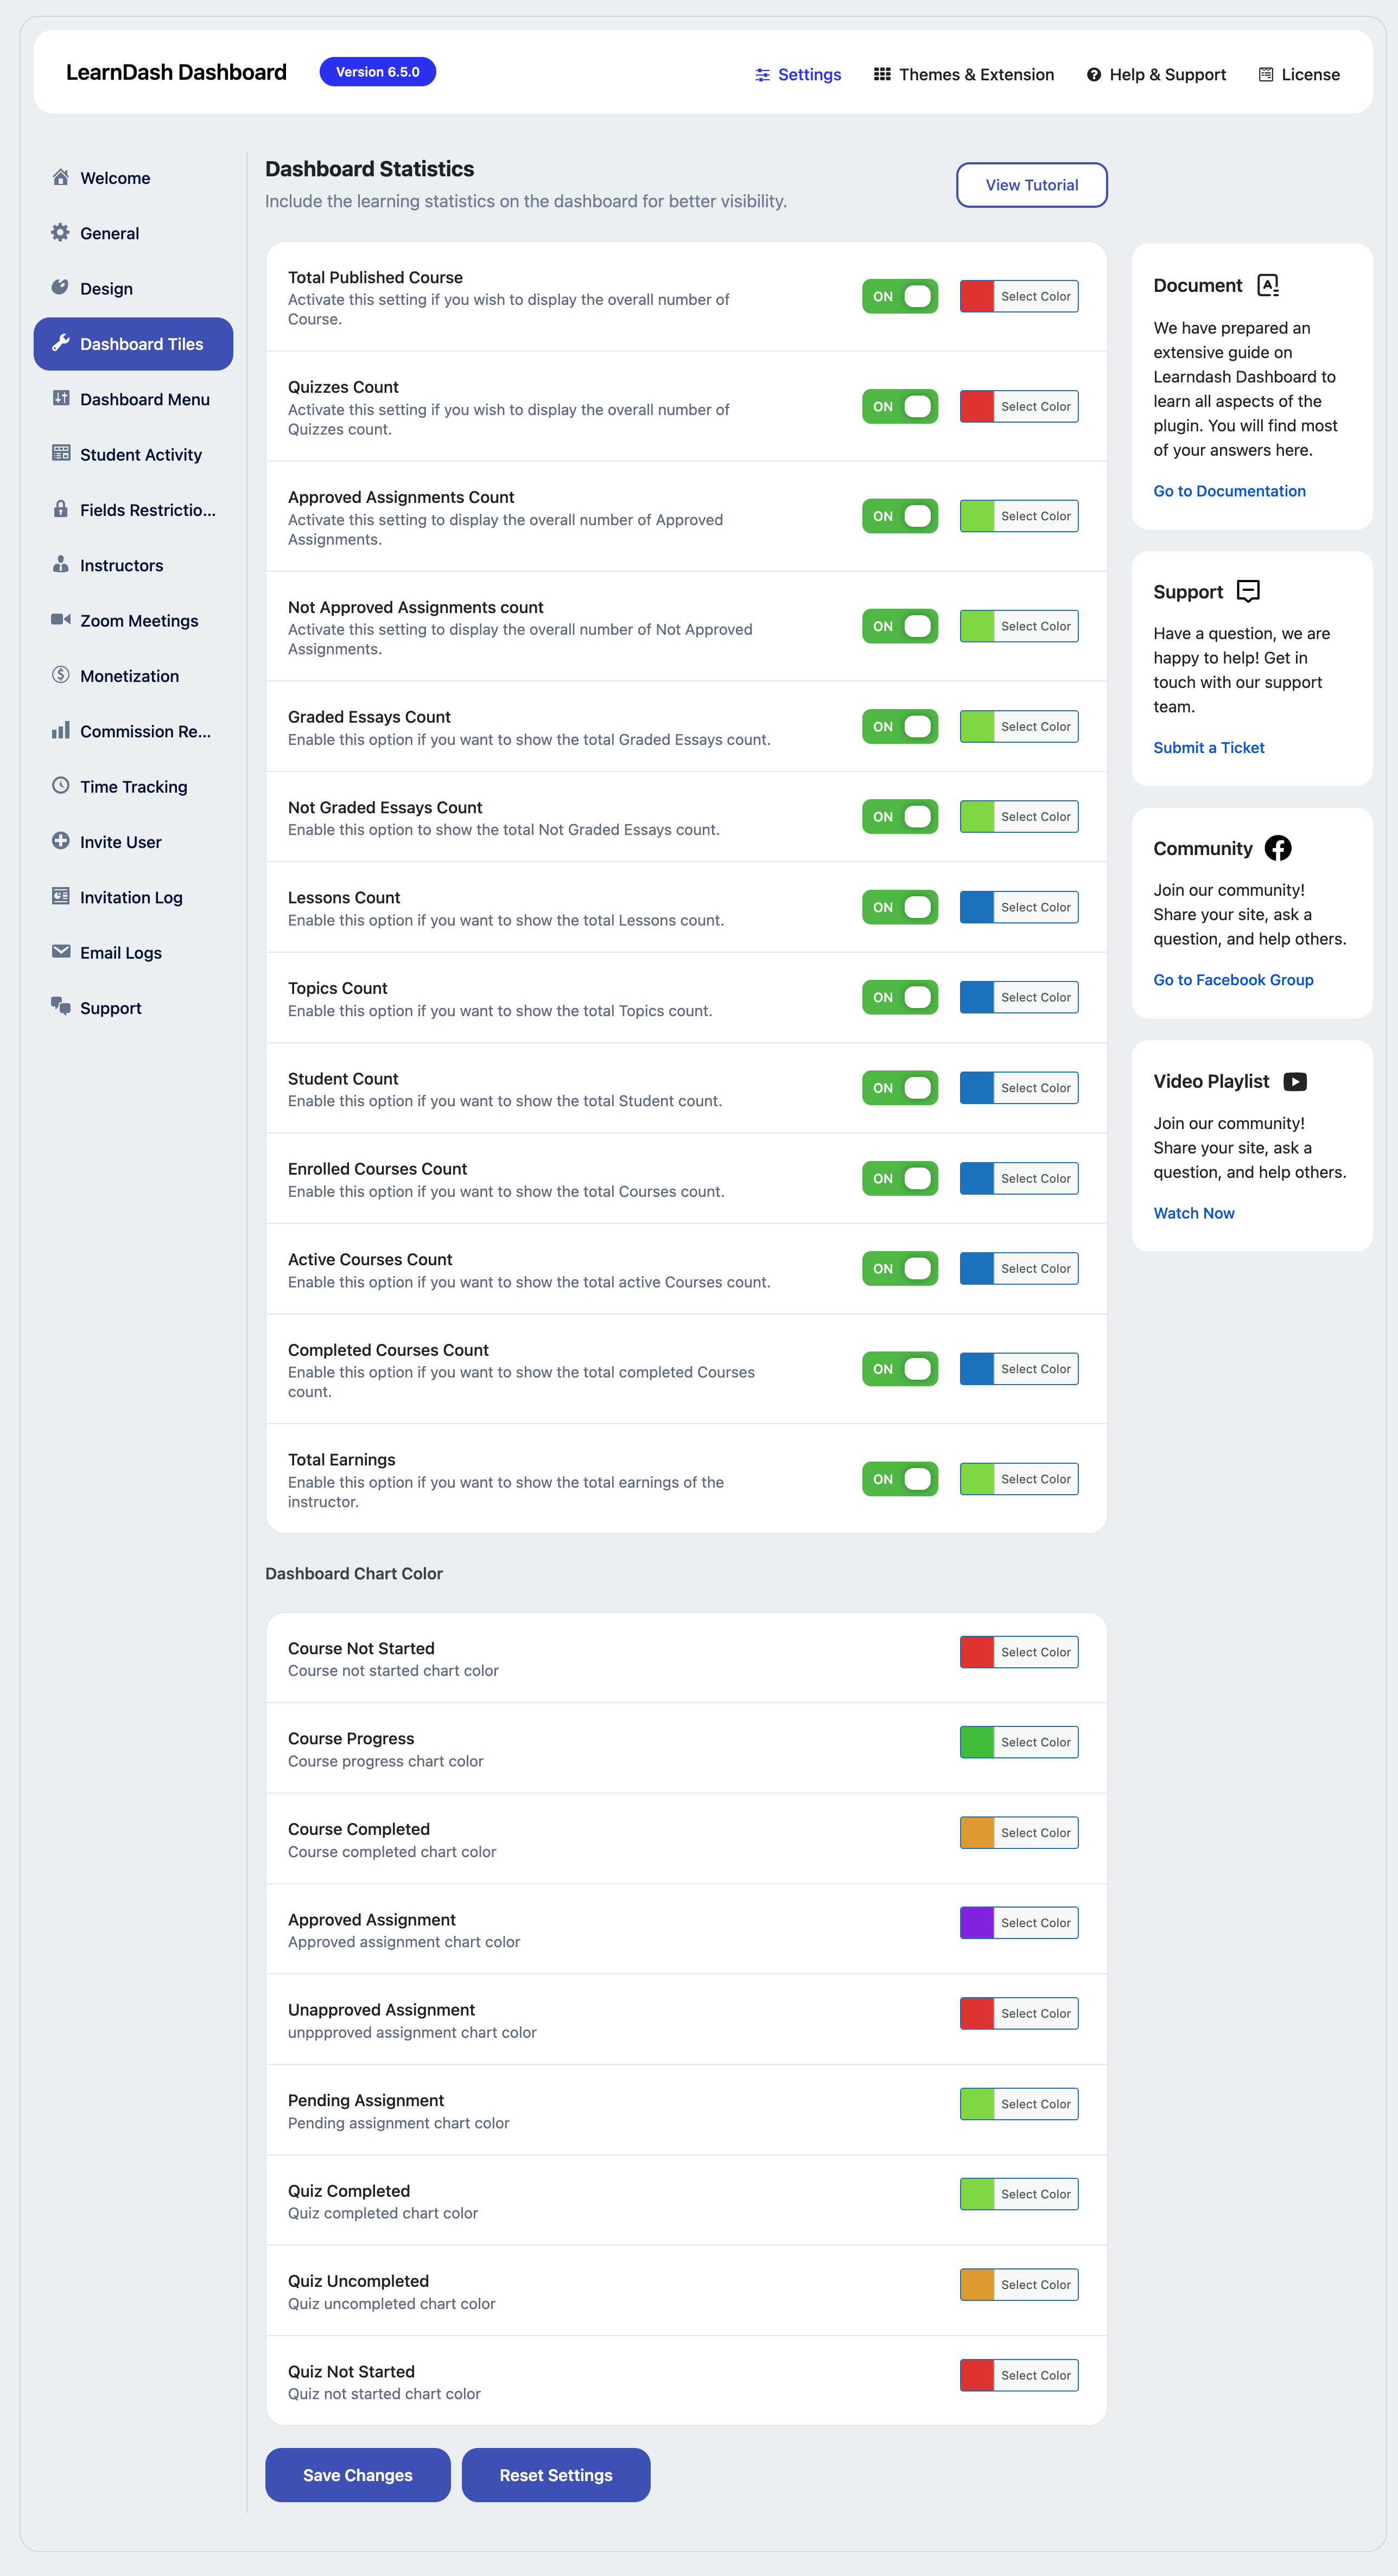
Dashboard Statistics
These options lets you show/hide the statistic tiles on the Dashboard, and you can change the color of the tiles according to your choice.
- Activate this setting if you wish to display the overall number of Course.
- Activate this setting if you wish to display the overall number of Quizzes count.
- Activate this setting to display the overall number of Approved Assignments.
- Activate this setting to display the overall number of Not Approved Assignments.
- Enable this option if you want to show the total Graded Essays count.
- Enable this option to show the total Not Graded Essays count.
- Enable this option if you want to show the total Lessons count.
- Enable this option if you want to show the total Courses count.
- Enable this option if you want to show the total active Courses count.
- Enable this option if you want to show the total completed Courses count.
- Enable this option if you want to show the total earnings of the instructor.