My Dashboard page of group leaders shows the following statistics:
Statistics Cards
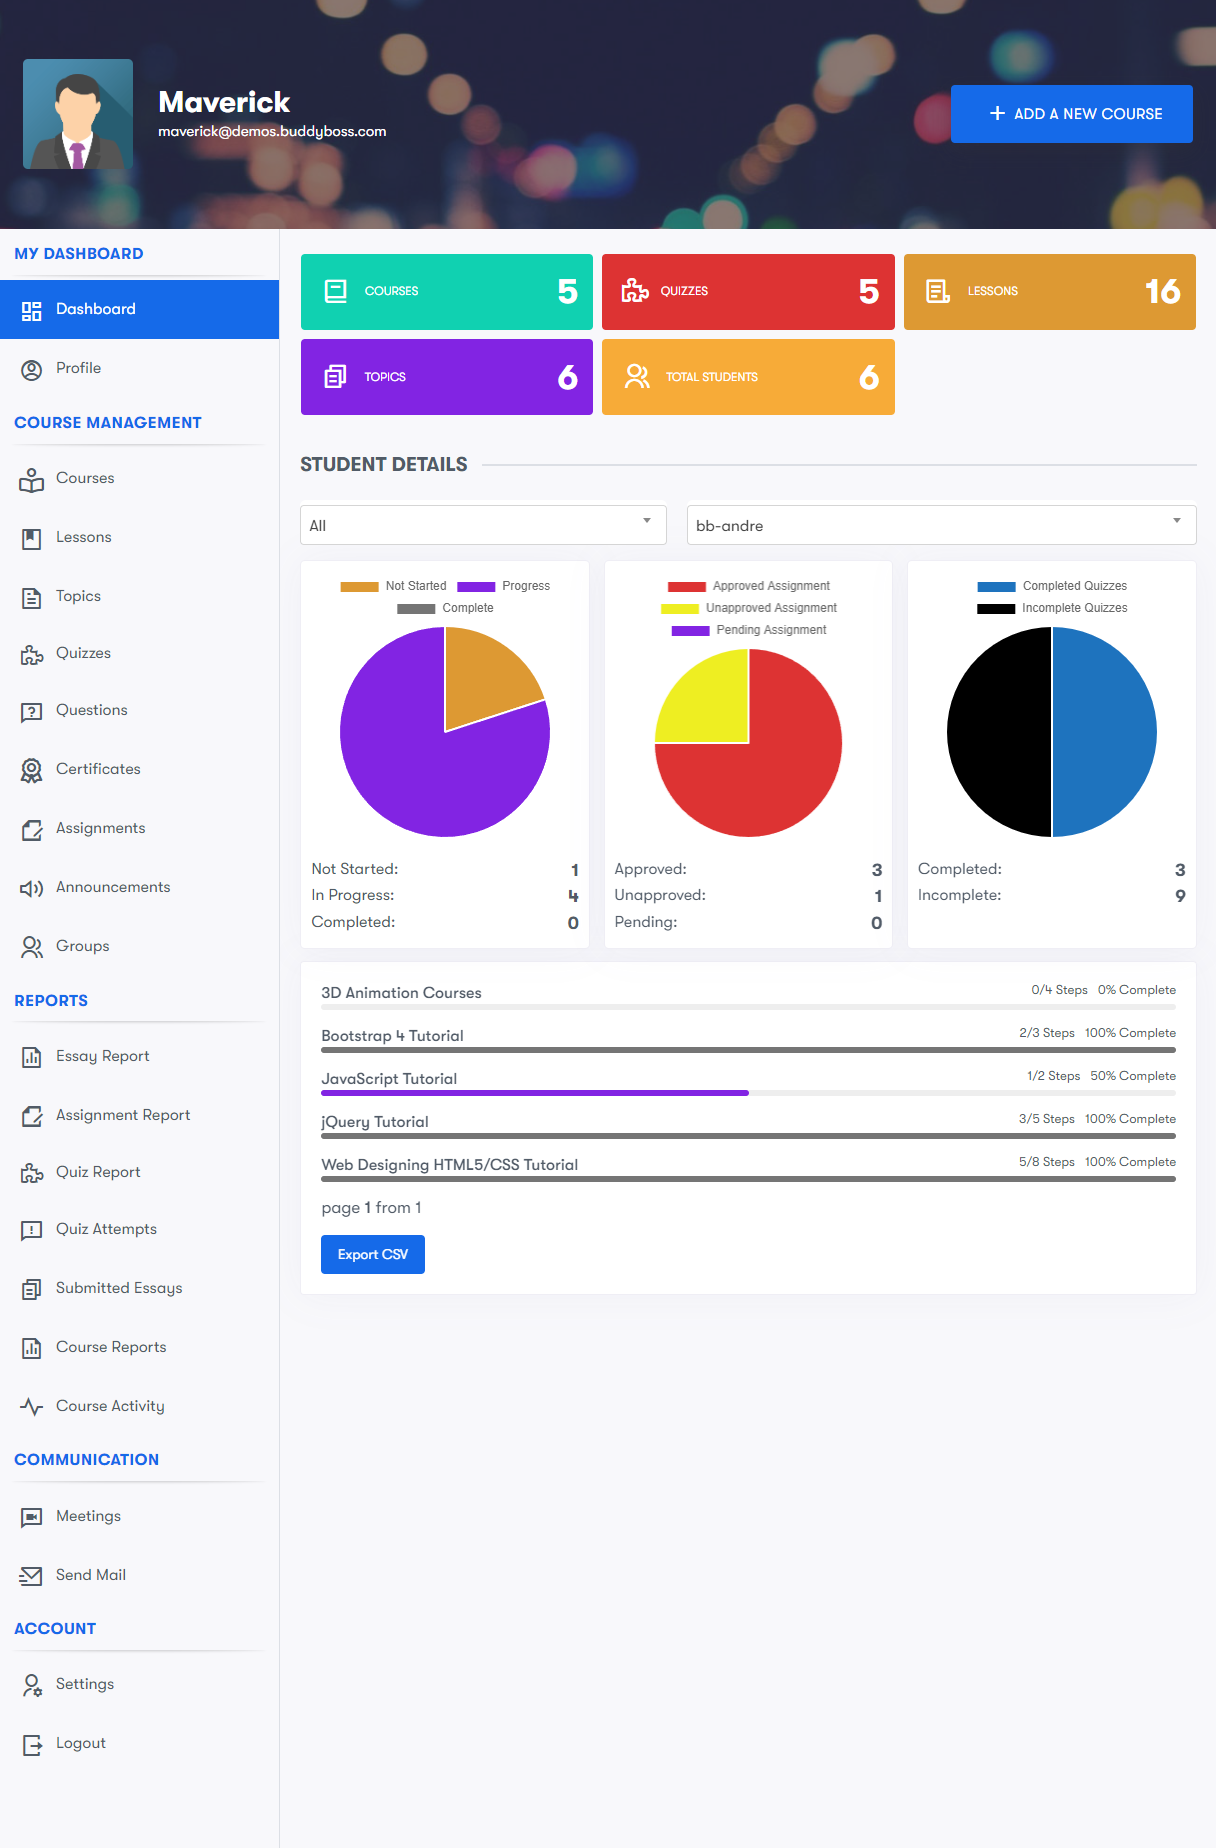
The upper section of the Dashboard shows statics of the following data:
- Number of courses
- Number of Quizzes
- Number of Lessons
- Number of topics
- Number of students
Most popular courses
This section displays the popular courses created by the instructor
Course Details
This section displays course-wise information.
A course dropdown is given there; selecting which students progress enrolled in that course(e.g., How many students have completed, started, on not started the course) will show in the pie chart as well as in the form of the student list. This list can also be exported in a CSV format with the click of the Export CSV button.
Student Details
This section displays student wise information in the following way:
A student dropdown is given there; on selecting which following pie graphs will be displayed :
Course Progress
Selected student’s all course progress in which he is enrolled will display. This data shows in the following values:
- Courses: Not Started in Percentage
- Courses: In Progress in Percentage
- Courses: Completed in percentage
Assignment Progress
The assignment progress pie chart will show the progress related to courses in which the student is enrolled.
- Assignment: Approved in percentage
- Assignment: Unapproved in percentage
- Assignment: Pending in percentage
Quiz Progress
The quiz progress pie chart will show the data related to the courses in which the student is enrolled.
- Quiz: Completed Quiz in percentage
- Quiz: Uncompleted Quiz in percentage
The courses progress bar section is also there, which shows courses progress for selected students, which can be exported in CSV format with one click of the Export CSV button.