

Reports & Workload
Kanbanomy to Reports gives you a portfolio-level view across every project, plus per-member workload - the numbers you need to answer “where do we stand?” and “who is overloaded?”
The Reports feature is toggle-gated; if you do not use it, turn it off under Settings and the screen and its API disappear.
Overview
Section titled “Overview”Portfolio KPIs computed across all projects:
- Projects by status and tasks by status.
- Overall completion rate.
- Overdue task count.
Choose a date range
Section titled “Choose a date range”By Project and Workload share one date range: All time, This week, Last week, This month, Last month or Custom (pick a From and To day). Days follow your site’s timezone, set under Settings > General, and weeks start on the day set there. The range stays selected as you switch tabs and pages.
Logged time against estimate
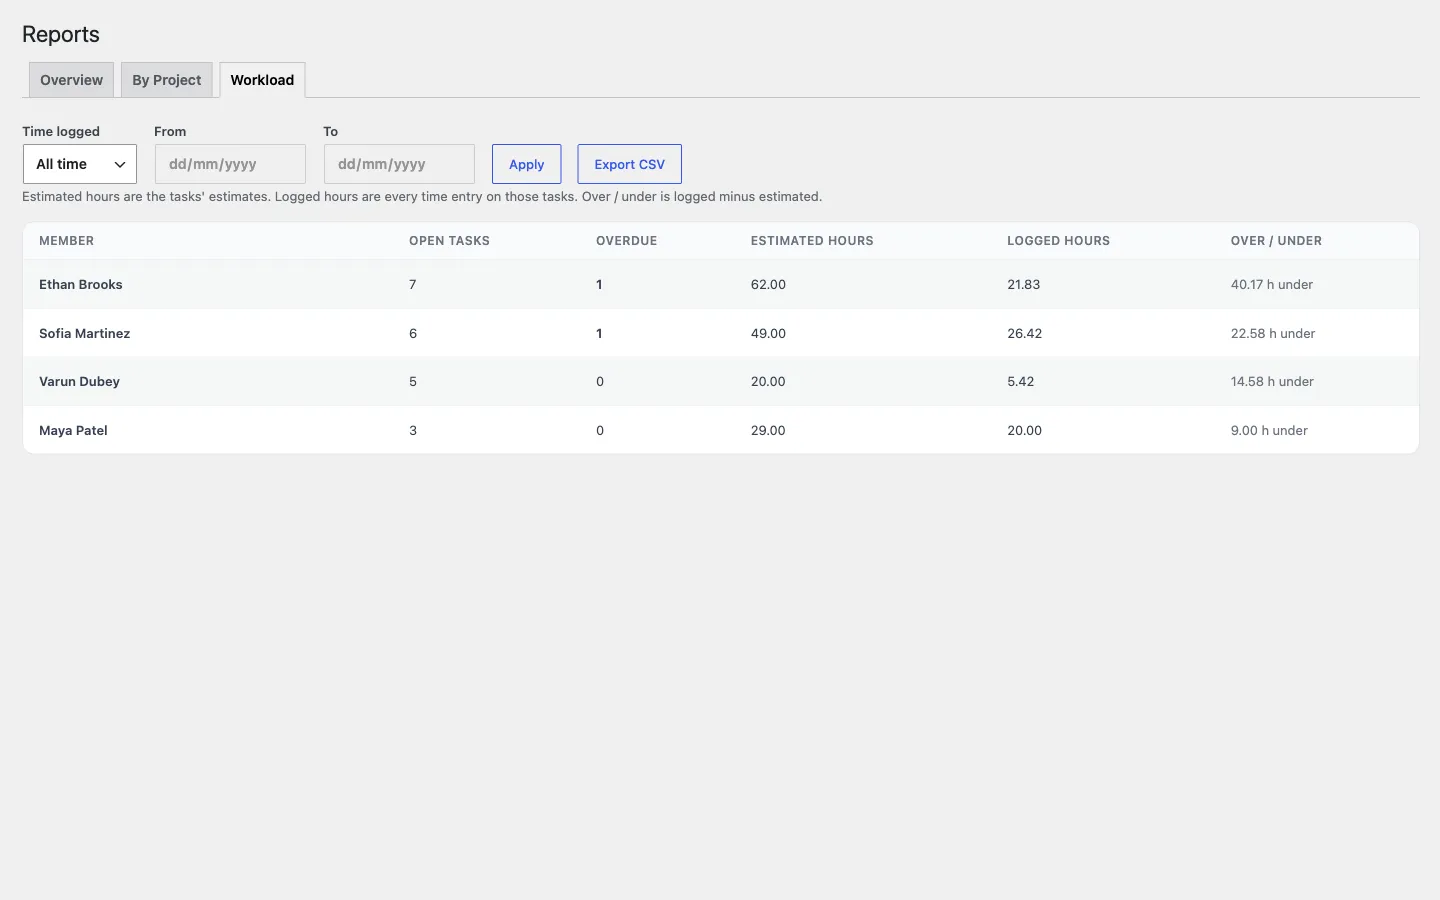
Section titled “Logged time against estimate”An estimate covers a whole task, not a week or a month, so comparing it with one range’s hours would make every short range read “under”. With All time selected, both tabs show:
- Estimated - the sum of the estimates on the tasks.
- Logged - all time logged on those tasks.
- Over / under - logged minus estimated, shown as X h over or X h under with a bar. A row with no estimate shows No estimate.
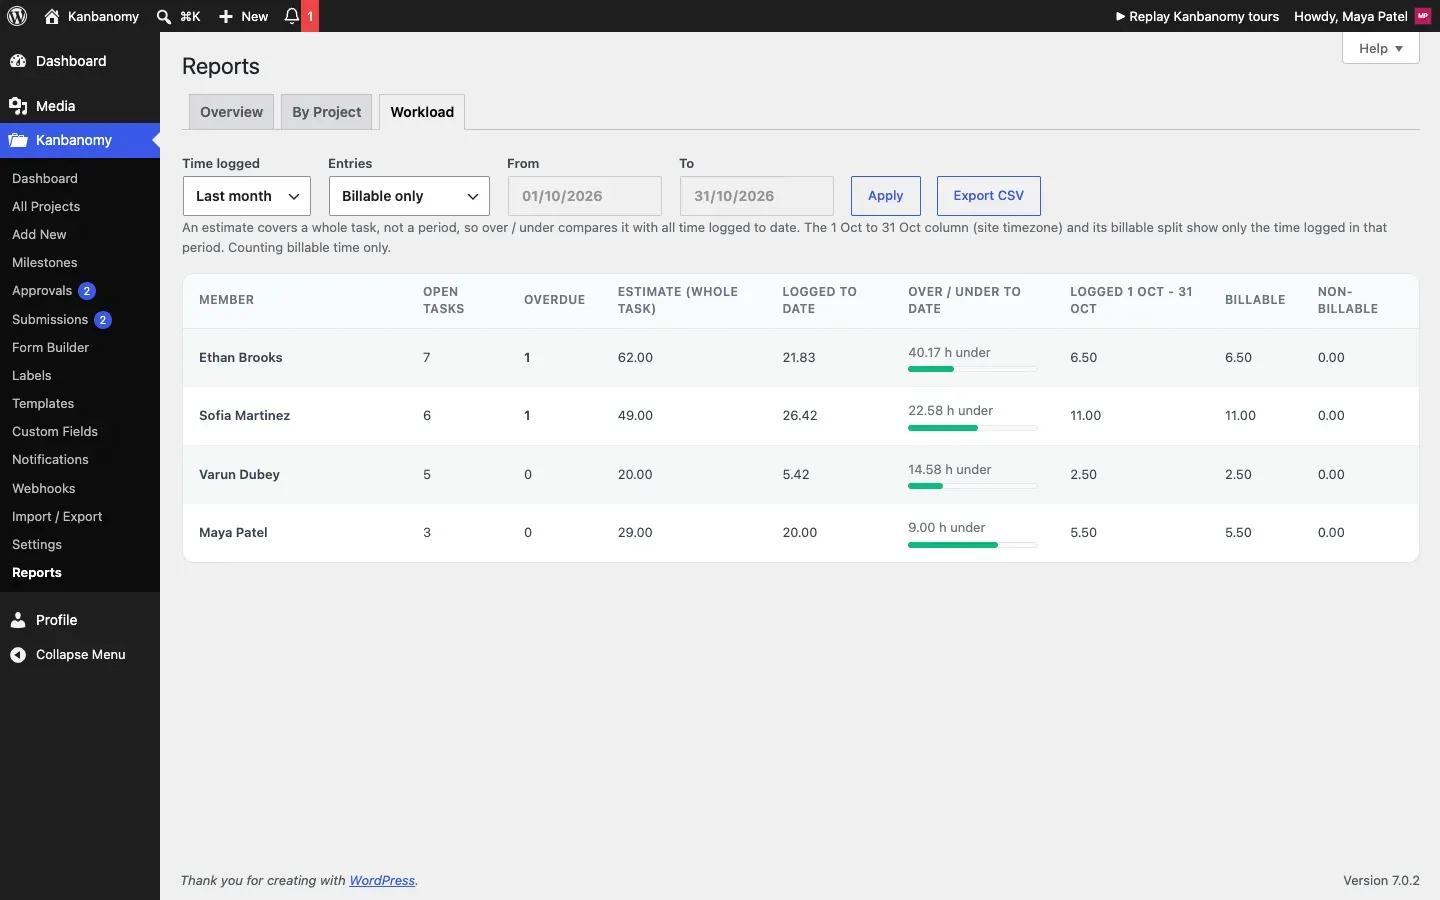
With a date range selected, the columns say what they compare:
- Estimate (whole task) and Logged to date - the full estimate and everything logged so far.
- Over / under to date - logged to date minus the estimate.
- Logged {range} - only the hours logged inside the range.
Every table also has Billable and Non-billable columns for the hours in view. A note above the table repeats this, so whoever reads an export knows what each column means.
Billable only
Section titled “Billable only”The Entries filter shows All time entries, Billable only or Non-billable only. It applies to both tabs and to the export. See Track time for how entries become billable.
Export to CSV
Section titled “Export to CSV”Export CSV downloads the tab you are looking at, for the selected range, with the same columns as the screen. Large portfolios export in batches, so the download works at thousands of projects.
By Project
Section titled “By Project”A per-project rollup - total tasks, completed, overdue, estimated and logged hours for each project - paginated so it stays fast across large portfolios. The figures are computed with aggregate queries, not by loading every task, so the screen performs the same at 50 projects or 5,000.
Workload
Section titled “Workload”Per-member workload:
- Open tasks assigned to each member and their overdue count.
- Estimated hours on their open tasks.
- Estimated hours on all their assigned tasks, the hours they logged to date and in the range, the difference, and the billable split.
Use it to rebalance assignments before someone becomes a bottleneck.
Who sees what
Section titled “Who sees what”Reports open in two places: Kanbanomy to Reports in wp-admin, and Reports on the front end (Hub, then Reports in the top bar, or /hub/?view=reports). The front-end page has the same By Project and Workload tabs, range bar and Export CSV.
| Person | What they see |
|---|---|
| Site manager | Every project and every person, in wp-admin and on the front end. The Overview tab is in wp-admin. |
| Project owner | On the front end: only the projects they own, and the people working on them. The page says so at the top. |
| Team member | On the front end, a My time page with their own row. Their Logged This Week also stays on the Hub. |
| Client, or someone on no project team | No Reports page. They see “Reports are for your team” and a link to the Hub. |
The REST API and the CSV export follow the same rule: GET /reports/projects answers managers and project owners, and the Workload API returns only your own row unless you can see more.
All three tabs are also available over the REST API (GET /kanbanomy/v1/reports/projects and /reports/workload take range, from, to, billable (all, billable or non_billable), page and per_page and return the same numbers as the screen) for building custom dashboards - see the Developer guide.