

Engagement
BuddyPress Statistics overviewPremiumGet BuddyPress Statistics →
Included in Free
The Engagement view is the third sub-tab under Analytics. Open it at WB Plugins > BP Statistics > Analytics > Engagement. It shows which kinds of activity drive interaction on your community over a period you choose.
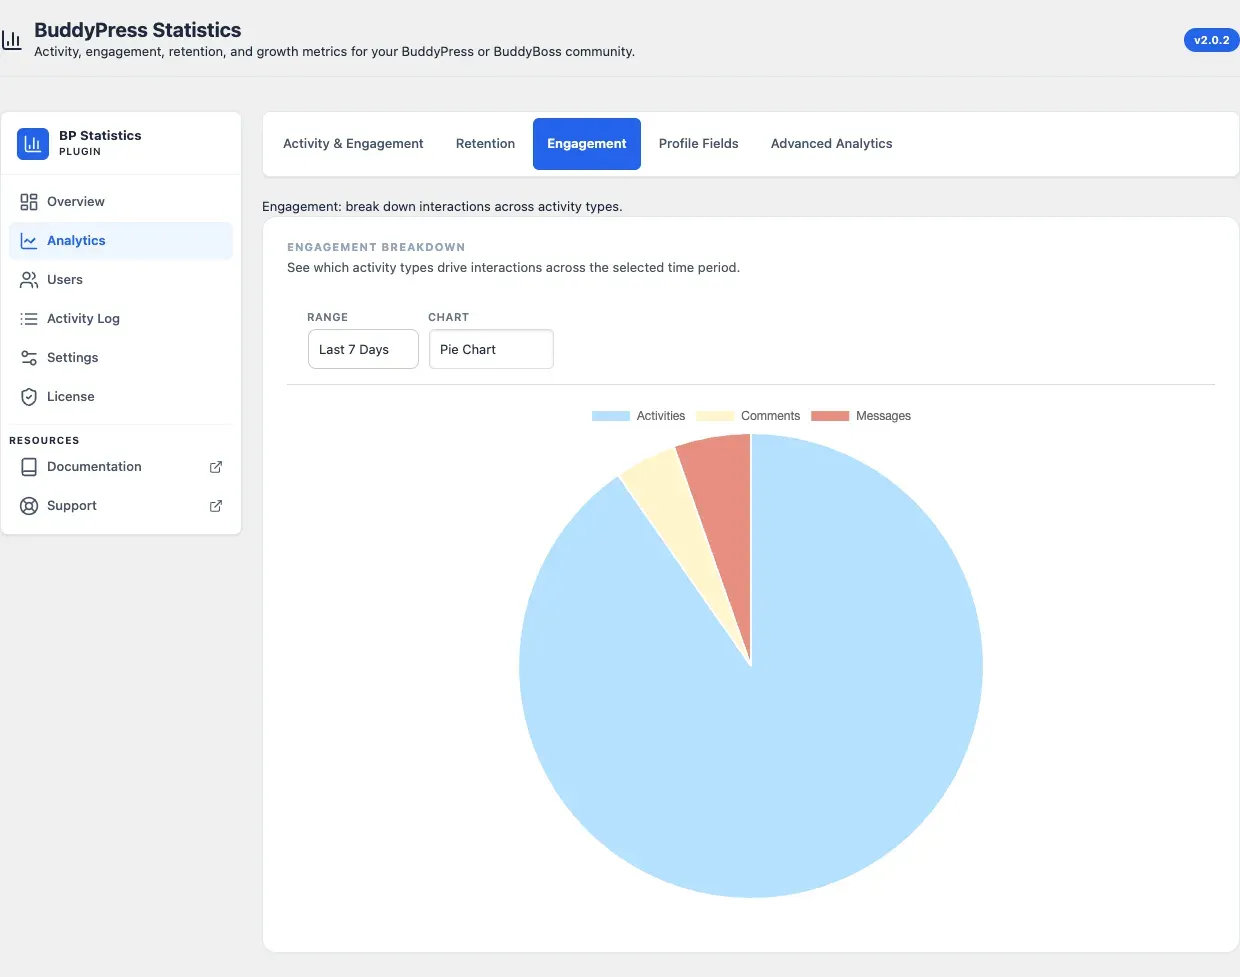
Engagement Breakdown
Section titled “Engagement Breakdown”The card compares three totals for the selected period:
- Activities - posts and other activity items members created.
- Comments - replies to activity items.
- Messages - private messages members sent.
Toolbar
Section titled “Toolbar”Two controls sit above the chart. The chart redraws as soon as you change either one.
| Control | Options |
|---|---|
| Range | Today, Yesterday, Last 7 Days, Last 14 Days, Last Month, Last 3 Months, Last 6 Months, Last Year |
| Chart | Pie Chart, Bar Chart, Trend Line Chart |
Use Pie Chart to see the share each type takes, Bar Chart to compare totals side by side, and Trend Line Chart to see how each type moves over the period.
When the chart is disabled
Section titled “When the chart is disabled”The chart needs the BuddyPress Activity component. If it is turned off, the card shows a notice instead of the chart. Turn it on at Settings > BuddyPress > Components, then reload the page.
Related
Section titled “Related”- Activity & Engagement - activity totals for the whole community or one group.
- Retention - how many members keep coming back.